This article helps you understand your Dashboard.
In this article:
What is the dashboard?
The Dashboard is an organized and comprehensive analytics tool that streamlines the way Vimeo OTT records and scales data. You can access the dashboard from the OTT Admin either when you first log in, or by clicking on the Analytics menu, and selecting Dashboard from the drop-down menu.
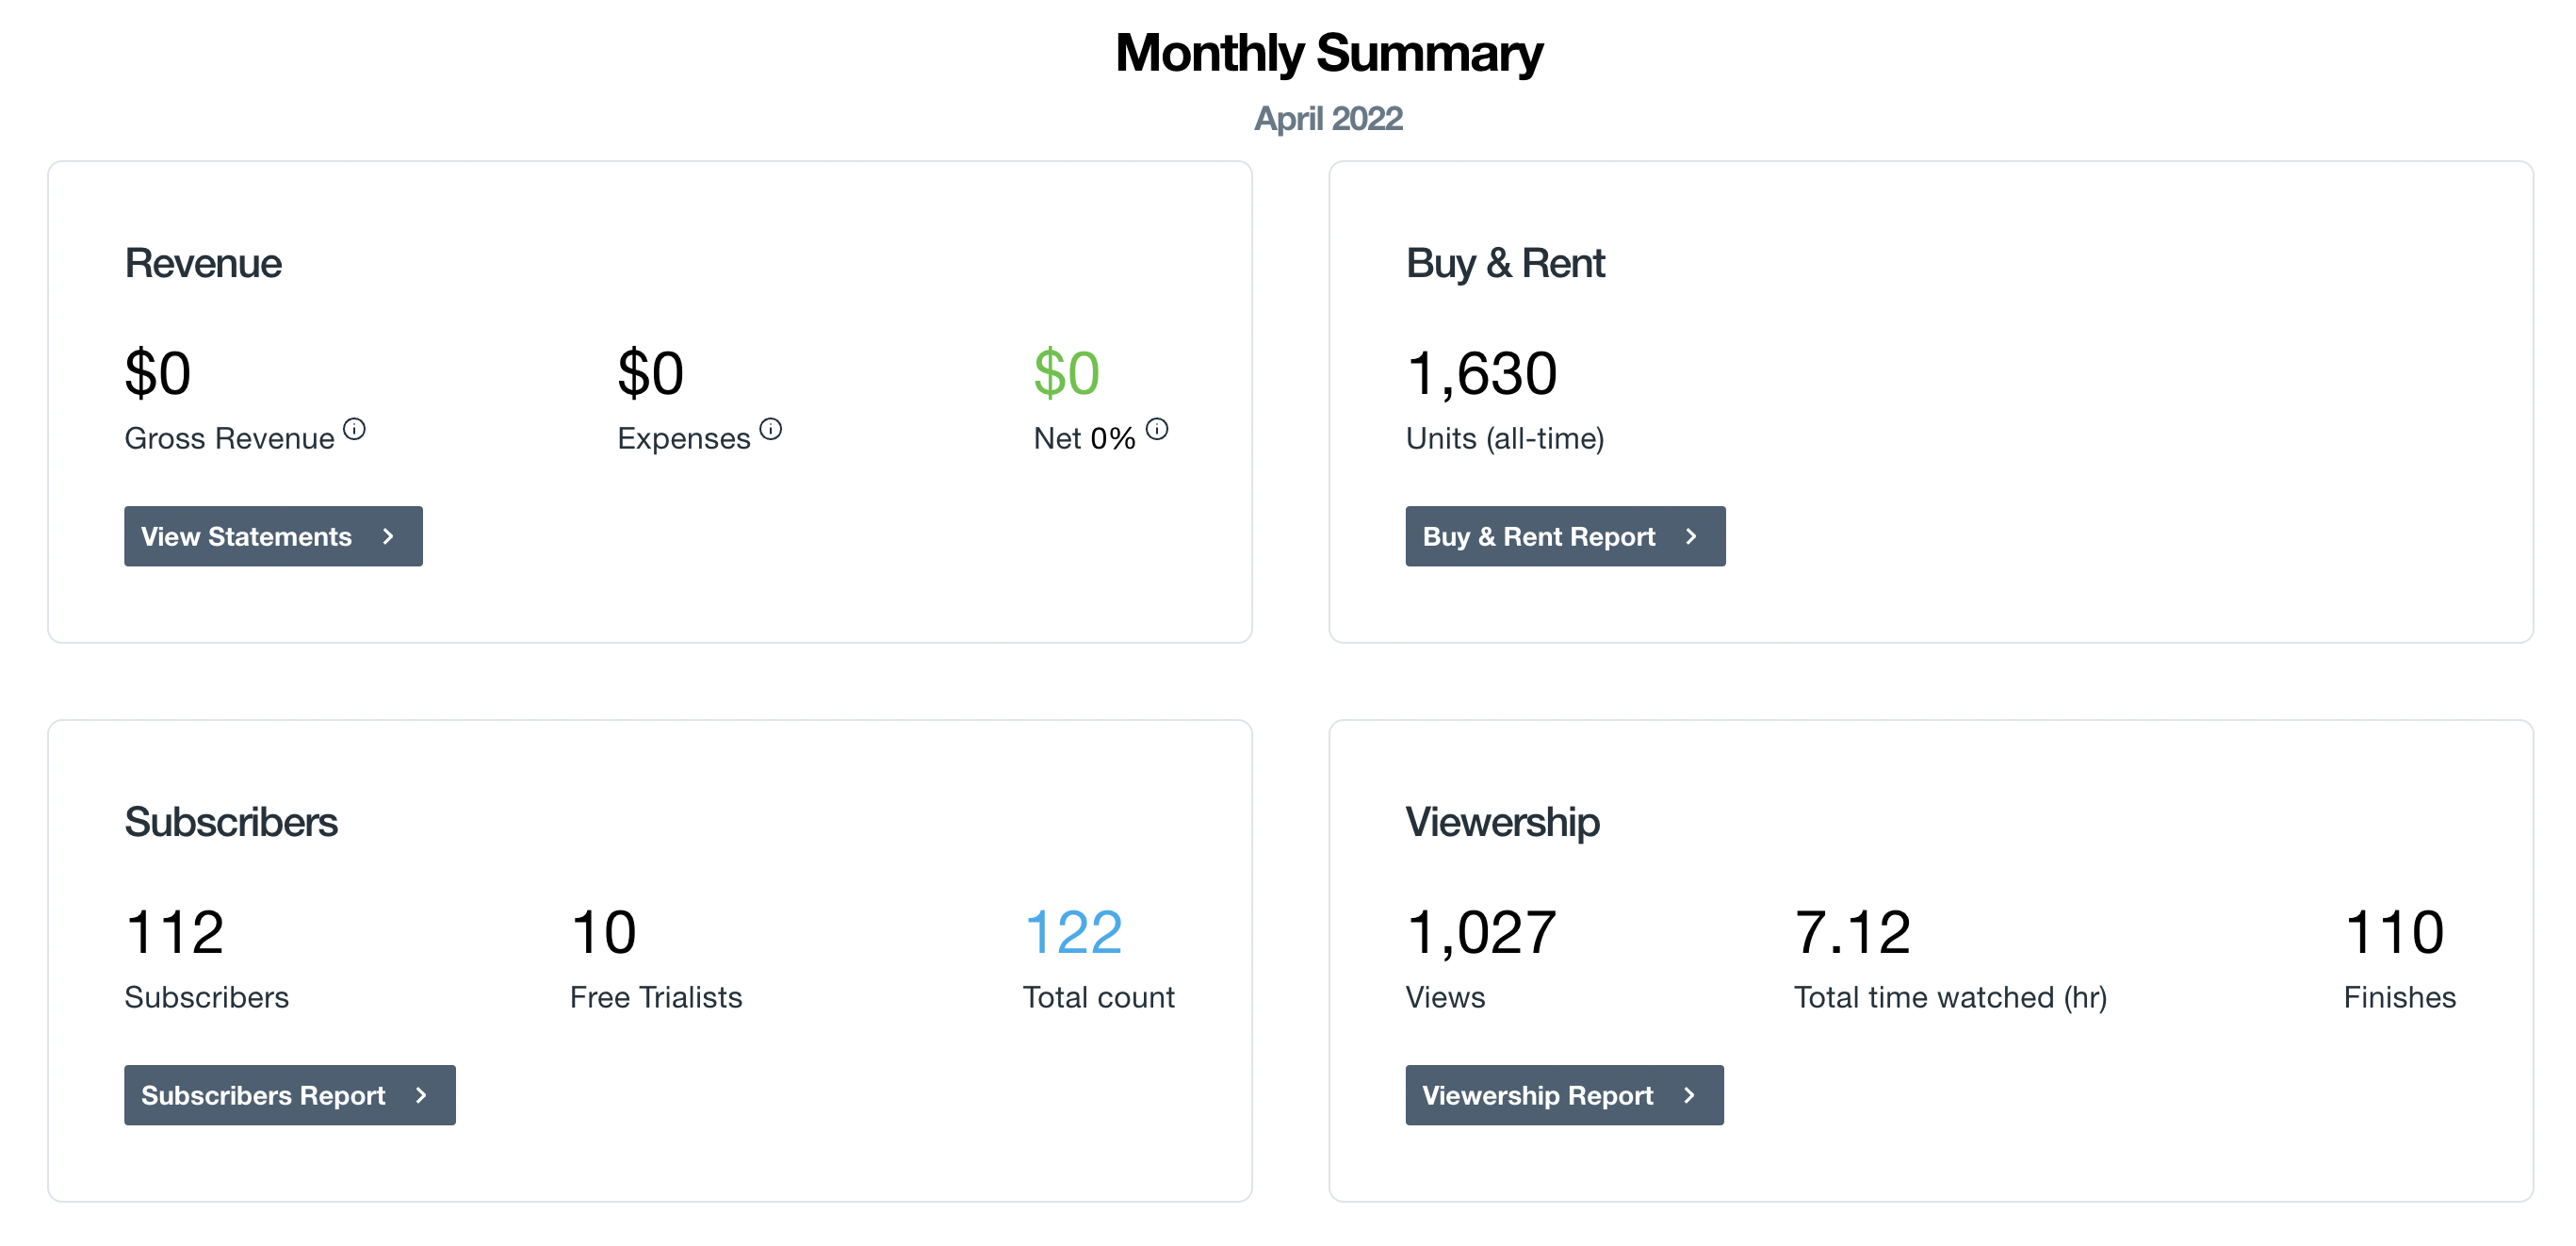
Once inside your dashboard, you’ll see your monthly activity summary. This gives you a snapshot of the revenue your site processes, and what you can expect payments from Vimeo to be like in the current calendar month. You’ll see Revenue, Buy and Rent and two new reports - Subscribers and Viewership. Revenue and Buy and Rent statements can be retrieved by clicking on the View statement.
⚠️Note: Data will not populate in the dashboard if you are browsing in incognito or private browser mode.
What analytics are available on the dashboard?
Revenue
This is all the revenue your video network has earned on Vimeo OTT over the past month. This doesn’t count revenue made on integrated platforms such as BigCommerce, branded apps, or through the API.
Click View Statements to find all the billing details, monthly statements, and invoices in the Payouts and Charges section. To know more about how the payout statement works, check out this article.
Buy and Rent
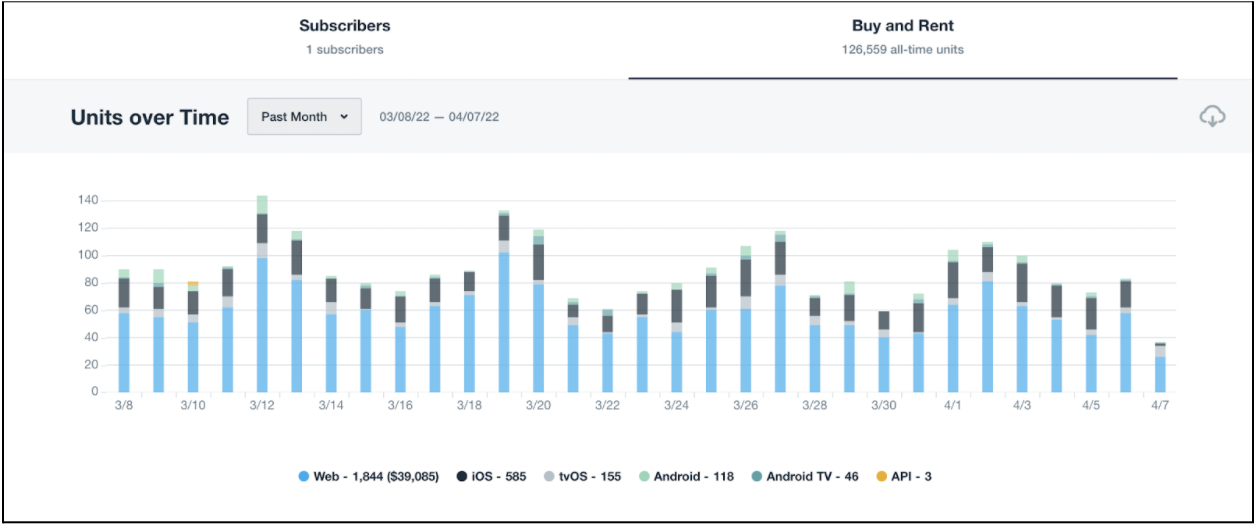
The Buy and Rent section of the Dashboard shows the total number of fulfillments of your transactional (TVOD) product units for the current calendar month. It does not include subscription (SVOD) products. Click Buy & Rent report to access the customizable report for additional insights.
The Units Over Time chart outlines product units sold/fulfilled over the time period selected. You can select a time period from the dropdown under the graph title, and choose from the Past Week, Past Month, Past 3 Months, Past 6 Months, Past Year, All Time, or a Custom date range.

If you click on a given bar in the chart, you will see the breakdown for that selected time period (i.e., if you’ve filtered for “Past year” in the graph, and click on the bar for March, you’ll see the breakdown for the units sold and fulfilled in March).
This chart also displays a breakdown of the type of fulfillment — Web purchases, purchase via your branded apps (e.g. iOS, Android, Android TV), API, and Free.
You can download the data statement from the downward button in the top right corner.
Viewership Report
The Viewership section of the dashboard summarises the total views, hours watched, and total finishes within the calendar month. Click Viewership report to access the full customizable report.
From there, you will see data displayed in a graph plot for aggregate viewership metrics like Views, Total time watched, Finishes, and Unique viewers, across your entire site, including any branded applications.
To access the report from the OTT Admin click on the Analytics menu, and select Viewership. To know more about how to customize your data, you can refer to this Viewership Report article.
Subscribers Report
The next report on the dashboard is the Subscribers report, which shows you your paying subscribers, current free trialists, and the sum of both metrics. Click on the Subscribers report to access the full customizable report.
The Subscribers report provides you with a measure of your subscription (SVOD) site’s growth and revenue over time. You can access the report from OTT Admin, click on the Analytics menu, and select Subscribers. To download the CSV file, click on the downward arrow icon.
To know more about customization and report generation in detail, refer to this Subscribers Report article.
Pause & Cancel Reasons

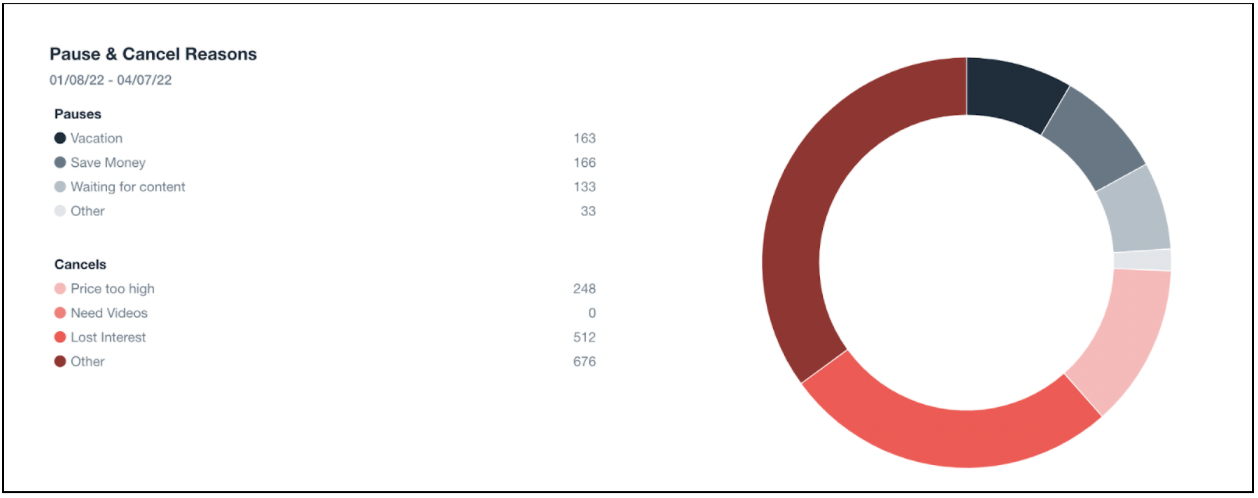
You can find the Pause & Cancel Reasons in the drop-down Analytics menu of OTT admin which is represented as a graph for the reasons your subscribers are considering canceling or pausing their subscriptions. These numbers are captured from a user survey presented when someone pauses or cancels a web subscription via the settings/purchases page. The chart presents these numbers in a rolling 3-month timeframe.
They can ‘Pause’ due to reasons like ‘Vacation’, ‘Save money’, ‘Waiting for content’, and ‘Other’.
Or, Cancel subscription owing to reasons like ‘Price too high’, ‘needs videos’, ‘Lost interest’, or ‘Other’.
⚠️Note: Not all "set cancellations" will actually result in a cancellation, since subscribers can change their minds after the cancellation. This chart will still include these subscribers in its count of Cancels since they would've noted a reason when they initially canceled.
